 jtsiirila
 siirila
Jared Siirila here for
Chrome DevTools
Save Time!
DevTools can do that?
Lose 30 pounds*
Weight loss not guaranteed
And Fun
Chrome Channels
| Channel | Description | |
|---|---|---|
 |
Stable | Standard released version. Major updates every 6 weeks. |
|
Beta | One step ahead of stable. Major updates every 6 weeks. |
|
Dev | First tested version. Updated 2-3 times per week. |
 |
Canary | Bleeding edge. Released daily. Untested and could be broken. |
Design
drop
elements
drag
and
to
rearrange
When editing almost any string containing a number in the Elements panel, the arrow keys can be used to increment/decrement the value
This works in suprising places, such as on Hex values
Hold the shift key to increment/decrement by 10 with the arrow keys
Hold the alt key to increment/decrement by .1 with the arrow keys
Color Picker
When using the color picker, if you move the mouse over the page a magnifying glass will appear that allows you to pick a specific pixel’s color
Shift+click on a color in the sidebar to switch between color formats (rgb, hex, hsl)
Select colors from the site's color palate
Media Queries
Not available in stores
Call now!
555-867-5309*
Jenny is standing by to take your call
Development
Tired of your mouse slowing you down?
You should try...
Keyboard Shortcuts
Navigate the DOM in the Elements panel using arrow keys
| Mac | Windows | Action |
|---|---|---|
| Esc | Esc | Shows/hides the console |
| Mac | Windows | Action |
|---|---|---|
| Cmd + ] | Ctrl + ] | Next panel in DevTools |
| Cmd + [ | Ctrl + [ | Previous panel in DevTools |
| Mac | Windows | Action |
|---|---|---|
| Cmd + P | Ctrl + P | Search for file by name |
| Mac | Windows | Action |
|---|---|---|
| Cmd + Opt + F | Ctrl + Shift + F | Search all sources for string |
| Mac | Windows | Action |
|---|---|---|
| Ctrl + G | Ctrl + G | Jump to a specific line number in the current file. |
Can also be done using the Search for file by name dialog by putting a : at the start
| Mac | Windows | Action |
|---|---|---|
| Cmd + opt + C | Ctrl + Shift + C | Toggle into inspect element mode when in the browser window. |
Useful to inspect elements that are hidden when the mouse moves out of them
| Mac | Windows | Action |
|---|---|---|
| Cmd + Shift + O | Ctrl + Shift + O | List and search functions in current file |
| Mac | Windows | Action |
|---|---|---|
| Cmd + Shift + D | Ctrl + Shift + D | Dock/Undock the DevTools with the browser window |
Did your DOM change and you can't find what caused it?
Tired of searching through code looking for the culprit?
DOM Breakpoints
Breakpoints for DOM tree modifications including attribute changes and element removal.
What editor would be complete without
Multi-carat
Hold Cmd (Ctrl on Windows) when selecting text to edit and it will allow multiple text selections.
An easier way to select multiple copies of the same word is with Cmd + D (Ctrl + D on Windows), which will select the next occurrence each time.
If you order Console.log today
We'll throw in absolutely FREE
console.clear() or clear()
Clears the console output
console.assert(expression, object)
Throws an error and stack trace if the expression passed into it is false
console.count(label)
Logs the # of times that count has been invoked at that line with that label.
console.profile([label]) console.profileEnd()
Starts and stop a JavaScript CPU profile if the DevTools are open
console.time(label) console.timeEnd(label)
Starts and stops a timer for the specified label. When stopped, the time elapsed is displayed in the console.
Other Useful functions in the Console
Not in the console object
These only exists inside the console!
$()
$$()
Aliases for document.querySelector() and document.querySelectorAll() respectively.
copy()
Copies whatever element is passsed into it to the clipboard
monitor(function)
When the specified function is called, a message is logged with the method name and arguments to the method.
monitorEvents(object,[events])
When one of the specified events occurs on the object, log the event object to the console.
Workspaces
Money back guaranteed!
How much would you pay?
$199
$59
6 Easy Payments of $0
Performance
and
Debugging
Preserve Log
Keeps the log between full page navigation. An option exists for this in both the Network panel and the Console
XHR Instant Replay!
Right click on any XHR request in the Network panel to have the option to replay that request
Show/Hide columns in the Network Panel
Rewind Debugger
When debugging code, rerun the code in the any frame in the Call Stack by right clicking the frame and selecting to Restart Frame
Conditional Breakpoints
Tired of having sequential messages stacked in the Console?
Enable "Show timestamps" in the Settings
Snippets
The Sources panel allows you to create, store, and run snippets of JavaScript
Store useful utilities
Grep
Attaches a Grep method to the Object prototype
jQuerify
Add jQuery to a page that doesn't have it
Log Globals
Find leaked globals
More snippets can be found at:
https://github.com/paulirish/devtools-addons/wiki/Snippets
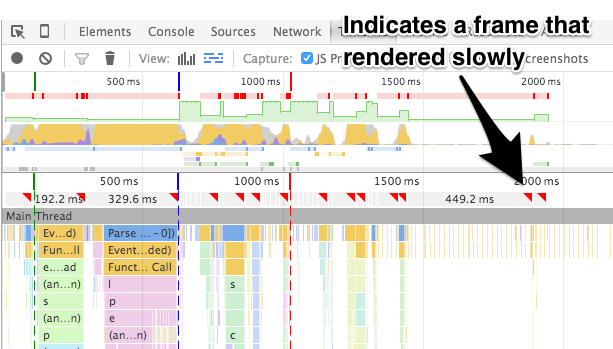
Timeline Panel Screenshots
Call now, and we'll double the offer!
555-867-5309
Network Panel Screenshots
Network panel filters
Many different filters such as larger-than and domain
Chrome will autocomplete the filters applicable to your data, so play around
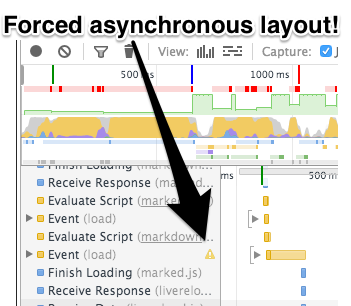
Timeline panel
But Wait, There's More!
DevTools all the way down
The DevTools themselves are a web app that can be edited by opening DevTools on them if they are undocked!
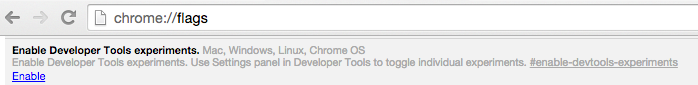
Enable DevTools Experiments